
Moneyball^2: How the Houston Astros are Using Statcast to Generate Wins and Profits
Jeff Luhnow and crew's algorithm-based roster building turns heads in the industry and in the bleachers.
The Houston Astros shocked the baseball world in 2015 by making the playoffs with an 86-76 record after going 70-92 and 51-111 in the prior two years. The Astros’ owner, Jim Crane, was not surprised in the slightest. The once dominant franchise had been running a $10MM+ annual deficit when he purchased it in 2011 for $680MM. Mr. Crane installed a new front office that emphasized brain power and analytical ability over actual baseball experience. He believed that a radical new business and operating model would be needed to return the Astros to their former glory. Jeff Luhnow, a Kellogg MBA with startup and consulting experience was hired to be the GM. He surrounded himself with NASA engineers, Ivy leaguers, data scientists, and consultants1.
The quickest way to boost profitability in baseball is to make the playoffs. Vince Gennaro found that playoff appearances result in a 20% increase in same-year net income and positive externalities for attendance, ratings, sponsorships, and concession sales over the next five years2. As such, the new Astros business model was to field a cheap team capable of overperforming to reach the playoffs. The tool they were going to utilize to find those players was Statcast.
Statcast, Major League Baseball’s new tracking technology, had recently been installed in all 30 MLB stadiums. The technology combines radar (from Trackman) and cameras (from ChyronHego) to measure the location and movement of the ball and every player on the field. It works by utilizing two camera arrays installed 45 feet apart. The positions give the cameras stereoscopic vision to judge depth and movement accurately. The radar is used to track every nuance of the baseball’s movement. Because the cameras record the position of every player 32 times per second and the radar samples the flight of the ball 20,000 per second3, the system generates 7 terabytes of data each game.

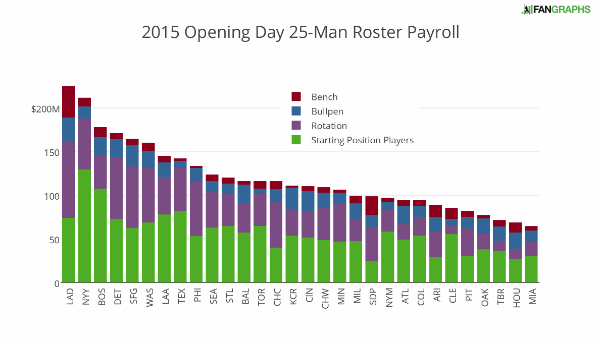
Jim Crane and Jeff Luhnow correctly recognized that teams better equipped to handle and manipulate large amounts of data had an edge over teams that valued traditional scouting and baseball knowledge. With 2,430 games and 750,000 pitches per season, the Astros built its operating model to tackle this massive digitized source of information by making a substantial investment in computing power. The Astros dug into the data to construct a cheap team in 2015 that they believed would significantly outperform their market value, as evidenced below:
On the pitching front, the team analyzed perceived velocity, pitcher release point, delivery time, horizontal and vertical ball movement, and the spin rate of each pitch4. Acting on this data, they acquired Colin McHugh for free after the Colorado Rockies released him due to his 0-8 record and 8.94 ERA (2+ deviations below the mean). Statcast showed that despite his poor results, he possessed a world class spin rate on his curveball (~2,000 RPMs vs. 1,500 RPMs) (source: source: http://www.bloomberg.com/news/articles/2014-08-28/extreme-moneyball-houston-astros-jeff-luhnow-lets-data-reign). The Astros harnessed the data to optimize his repertoire and he won 30 games (16 losses) with a strong 3.39 ERA in the two years following the acquisition. They also realized that hard throwing pitchers were overvalued, and targeted soft tossers who generated low exit velocity contact from hitters (ranking # 1 in the MLB in 2015)5.

Statcast data of fielders’ acceleration, speed, distance travelled, and route efficiency was also used to optimize the team’s defense. The Astros charted spray charts for every hitter against every pitcher to determine the optimal way to position its defenders. The Astro’s abandonment of tradition positions shook the baseball world, but resulted in a top defensive unit in 20156.
The brain trust also analyzed new metrics for hitters including exit velocity, launch angle, and vector of the ball off the bat to build a cheap lineup that struck out a lot but generated excess value by hitting the ball extremely hard (6th best in 2015)7. This culminated in the Astros reaching the playoffs for the first time in 10 years and generating the 2nd highest profits in all of baseball ($67MM)8 It’s franchise value has doubled to $1.1B while the Rockies’ value has lagged to 5th worst in the league. However, the Astros’ success causes challenges for the team including retaining analysts (Stearns has since been poached) and staying ahead of the curve (all teams have access to Statcast).
Suggestions for the Future:
- The Astros should significantly increase its brain trust to stay ahead of the other 29 teams. Front office hires generally make 5x less than the minimum salary for a single MLB player but have an outsized effect on team performance.
- To generate sustainable long-term value, the club should avoid signing aging premium talent as other top clubs do. They should focus on short-term contracts to keep the payroll flexible to exploit new inefficiencies that the data yields.
(794 words)
Sources:
1 Reiter, B. (2014, June 20). Astro-Matic baseball. Retrieved November 15, 2016, from Sports Illustrated, http://www.si.com/longform/astros/
2 Barmasse, J. (2014, October 2). How Much Value Does a Postseason Appearance Hold for MLB franchises? Retrieved November 15, 2016, from The Fields of Green, http://thefieldsofgreen.com/2014/10/02/how-much-value-does-a-postseason-appearance-hold-for-mlb-franchises/
3 Lindbergh, B. (2014, March 3). Overthinking it: Takeaways from our First Look at the Future. Retrieved November 16, 2016, from Baseball Prospectus, http://www.baseballprospectus.com/a/22946
4 Casella, P. (2015, April 24). Statcast primer: Baseball will never be the same. Retrieved November 18, 2016, from MLB, http://m.mlb.com/news/article/119234412/statcast-primer-baseball-will-never-be-the-same/
6 Lindbergh, B. (2015, May 7). Houston, we Have a Pulse: 10 Stats That Explain the Astros’ Resurgence. Retrieved November 16, 2016, from Grantland, http://grantland.com/the-triangle/2015-mlb-houston-astros-10-stats-to-explain-first-place-start/
8 Furr, L. (2016, March 24). Houston Among Most Profitable in the MLB, Value Jumps on Forbes’ List. Retrieved November 17, 2016, from Houston Business Journal, http://www.bizjournals.com/houston/morning_call/2016/03/astros-among-most-profitable-in-the-mlb-value.html
This analysis was great, but I have an issue with your recommendation to focus on short term contracts to remain flexible. I understand the logic. On the other hand, as other teams grow their analytics capabilities and try to poach the best players per their KPIs, how can you expect the Astros to continue their success? As of 2015, there were nine teams that fully subscribed to using analytics, with others moving in that direction.[1] Players are motivated by guaranteed, long term contracts. It would seem to be easy for other teams to offer better terms and take your talent if you cannot lock your high performers into longer term contracts.
[1] Nick Lampe “2015 playoff teams and the use of analytics.” SB Nation. http://www.beyondtheboxscore.com/2015/10/8/9470427/2015-playoff-teams-and-the-use-of-analytics Accessed November 18, 2016.
Do you see the future of baseball as all teams using data analytics to improve their teams? Will the next edge be who has the best analytics team and is able to then translate this data analysis to better talent acquisition or even a complete re-definition of what “talent” is in the baseball industry?
In the end, baseball as all other sports is both a competitive sport just as much as it is a performance. Will the performance expected change in the future of baseball? As we saw in Moneyball they were switching from players who hit a lot of home runs (which is something exciting to watch as a spectator) vs. batters who would get on base more frequently. If we see more teams heading this direction we could see a completely different baseball game in the future (not to judge if it is something better or something worse). This is in line with better strategic plays coming from the managers. Sometimes when a player should bunt the manager lets them bat because “they could hit a home run” even though it is highly unlikely and the smartest play was to bunt.
Cool post Hunter – I loved reading Moneyball and watching the movie, so enjoyed being reminded of the power of data analysis in building a baseball team, and how it’s been recently re-applied. I’m skeptical of the sustainability of the Astros’ success due to some of the reasons you’ve outlined in your post (e.g., the league-wide access to Statcast, poaching of players), which also causes me to be skeptical of Jim Crane’s initial intentions of purchasing the team. In a way, it seems like a simple buy-it and flip-it investment strategy, so I am curious what his intended ‘exit plans’ for his investment could be… or if he is intending to hold it long-term.
That said, I agree with your implied suggestion to better compensate their data analysts. Clearly, applied statistical analysis can reap enormous benefits for a baseball team (particularly given the enormous sample size of data available), so it deserves greater acknowledgement (and compensation!) by the team owners. I’m personally curious if the same type of analytical rigor could be applied in assessing other sports as well. Baseball is generally viewed as a sport that’s declining in popularity [1]… so I wonder if (1) this ‘digitalization’ of baseball can help revive America’s interest in the sport, and (2) the applied statistical lessons can be transferred to other sports growing in popularity. Basketball and hockey are two initial sports that come to mind given their similar volume of potential data available.
[1] https://www.washingtonpost.com/sports/nationals/baseballs-trouble-with-the-youth-curve–and-what-that-means-for-the-game/2015/04/05/2da36dca-d7e8-11e4-8103-fa84725dbf9d_story.html